

Interface tour
A guided tour of the QoreDB workspace, from the sidebar and tabs to the editor, results pane, and the navigation patterns you'll use every day.
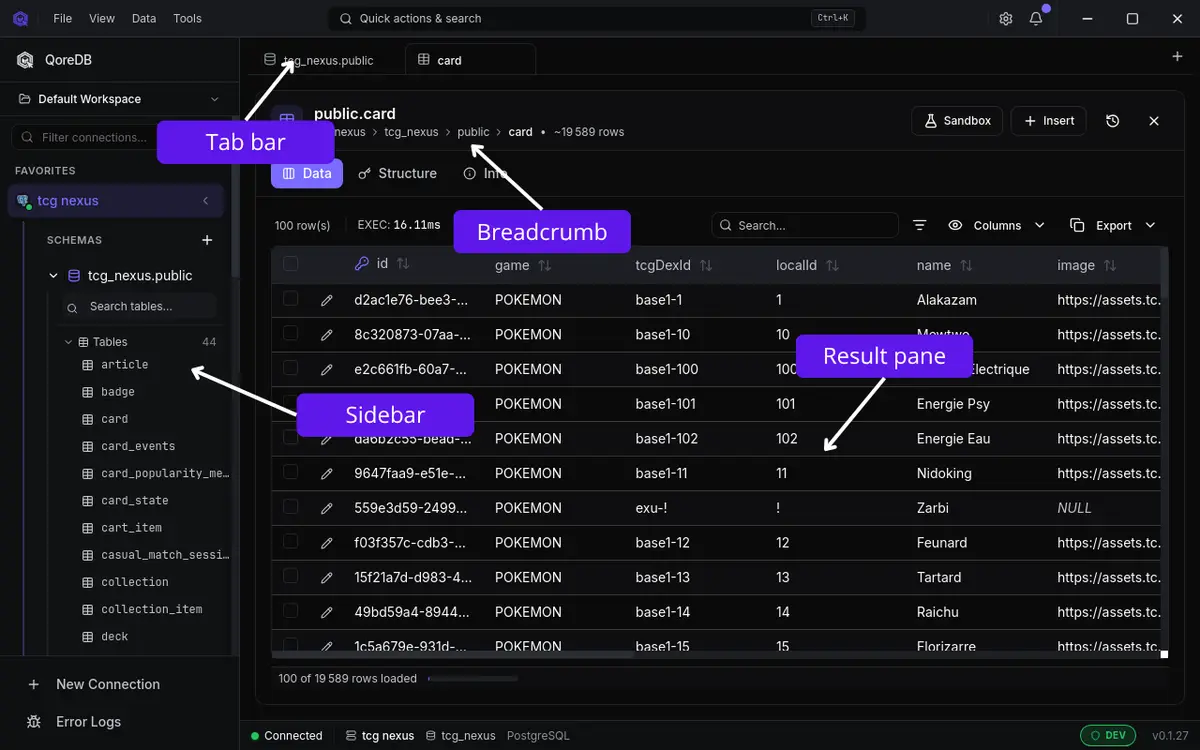
The QoreDB window is organized into three horizontal zones: a thin title bar at the top, a resizable sidebar on the left, and a main area on the right that holds the tab bar, the active tab content, and a status bar. This page covers each zone, plus the global navigation patterns (Cmd/Ctrl + K, breadcrumbs, settings) that tie them together.
The title bar
A custom title bar runs across the top of the window. From left to right it typically holds the QoreDB brand and quick-access buttons for the things you reach for most often: global search, history, settings.
The title bar is always visible unless you turn on Zen Mode, which hides the title bar, sidebar, tab bar and status bar to leave only the active tab. Useful for screenshots, screencasts, or focused work.
The sidebar
The sidebar is the left-hand strip and is your home base. It is a single vertical list (not a tabbed panel). Top to bottom it contains:
- Branding header, with the QoreDB logo and your current license badge.
- Workspace switcher, a dropdown to change the active workspace (see below).
- Connections list, scrollable and searchable. Favorites appear at the top and the rest below. Click a connection to expand it; an expanded connection shows its databases, schemas and tables in a tree.
- Footer actions, with New Connection and a quick-access Error Logs button.
You cannot collapse the sidebar into icons, but you can:
- Resize it by dragging its right border to make it wider or narrower.
- Hide it entirely from the keyboard or via the command palette.
Workspaces
A workspace is a project-scoped grouping of connections. You might have one workspace for your personal side project, another for your day job, and a third for a contracting client. Switching workspaces gives you a clean slate (different connections, different saved-query library, different history).
Workspaces are managed from the workspace switcher at the top of the sidebar. Open it to see:
- Default, the workspace QoreDB uses out of the box.
- Recent workspaces, the last few you opened.
- Actions to create, open, or rename a workspace.
A workspace is just a folder on disk that contains a small .qoredb/workspace.json manifest. You can keep workspace folders in version control or sync them with your favorite tool if you want to.
The tab bar
Above the main area, the tab bar holds whatever you are working on right now: query tabs, table views, notebooks, settings, and so on.
Tabs support:
- Drag-and-drop reorder, both within and across groups.
- Pinned tabs, which sit before regular tabs and survive a "Close Others".
- Group by connection, an optional layout where tabs are grouped by the connection they belong to, with a colored bar indicating the group.
- Tab list dropdown, useful when you have too many tabs to see them all in the bar.
Tabs and their state persist when you quit and relaunch QoreDB. You will land back exactly where you left off.
The editor pane
The central area shows the active tab. Depending on what you opened, it can be:
- A SQL editor (CodeMirror) with syntax highlighting, autocomplete on keywords, snippets, and schema-aware suggestions for tables and columns. Run with
Cmd/Ctrl + Enter, run only the selection withCmd/Ctrl + Shift + Enter. - A MongoDB editor with collection and operator autocomplete and a real-time JSON linter that flags invalid input as you type.
- A table browser to inspect rows of a table, with sortable columns, per-column filters, inline editing, and pagination.
- A notebook, mixing SQL and Markdown cells (and chart cells in Pro).
- A DDL editor for CREATE and ALTER TABLE, with a live, driver-specific SQL preview.
Each tab keeps its own state (scroll position, active filter, selection), so you can hop around without losing context.
The results pane
When a query returns rows, they appear in a results grid built on TanStack Table with row virtualization, so a million-row result set still scrolls smoothly. You get:
- Sortable column headers.
- Per-column filters to narrow the view without re-running the query.
- Inline editing: double-click a cell to edit it.
- Row modal for a full-screen view and edit of a single row.
- Pagination with selectable page sizes (25, 50, 100, 250).
- Foreign key peek to see related rows from a referenced table without leaving the grid.
- Export of the current result set to CSV, JSON and other formats.
Breadcrumbs
When you open a table, a breadcrumb path sits above the data: Connection > Database > Schema > Table. Each segment is clickable so you can jump back up the hierarchy in one click. This is often faster than walking back through the sidebar tree.
Global search with Cmd / Ctrl + K
Press Cmd+K to open the global search palette. From a single fuzzy-search box you can find and jump to:
- Commands (open settings, toggle theme, change workspace, etc.).
- Features, like opening a notebook, the sandbox, the federation tab, the diff tool.
- Connections, any saved connection across workspaces.
- Query history, every query you have run.
- Query library, your saved queries and folders.
- Favorites, queries you starred.
This is the fastest way to navigate around QoreDB. Most regulars never click around in the sidebar; they live inside the command palette.
Library, history and notebooks
Three frequently-used surfaces do not live in the sidebar but are one shortcut away:
- Query library opens with
Cmd/Ctrl + Shift + L(or via the command palette). It is a searchable, foldered store of your saved queries, with tags and favorites. - Query history opens from the title bar (or via the command palette). It lists every query you have run, with full text and timestamps. You can re-run, copy, or favorite an entry.
- Notebooks are a tab type. Create one with
Cmd/Ctrl + Nfrom inside an active connection, or from the command palette. Once open, a notebook lives in a tab like any other.
Theme
QoreDB ships with a light theme, a dark theme, and an auto mode that follows your operating system. You can switch from the settings (General section) or via the command palette (Cmd/Ctrl + K, then "Toggle theme"). Your choice persists across sessions.
Settings
Open settings with Cmd+,, from the title bar, or via the command palette. Settings are organized into sections:
- General: language, theme, appearance, tab grouping, version info.
- Editor: editor and sandbox behavior, draft management.
- Security: safety rules, production-environment confirmations, query interceptor.
- Data: query history, logs, backups, time-travel, exports and imports.
- Shortcuts: a searchable view of every keybinding.
- License: activation and tier information.
- AI: configure your AI provider (OpenAI, Anthropic, Mistral, and others) with your own keys (BYOK).
Notifications
QoreDB shows transient toast notifications in the bottom-right corner of the window. There are four levels (success, info, warning, error) with sensible default durations. Errors stay visible longer so you have time to read them.
Status bar
A thin status bar at the bottom of the main area shows the current state: the active connection and its environment (development, staging, production), connection health, and other contextual indicators. The environment tag is purely informational, but other features (such as production-confirmation prompts) react to it.
Where to go next
You've now got the full mental model of the QoreDB UI. Pick whichever rabbit hole is most relevant to your work:
- PostgreSQL connections and other driver-specific guides
- Querying: editor and autocomplete
- Reference: keyboard shortcuts
Stay updated on new releases
Subscribe to get product releases, new drivers notifications, and technical tutorials.